Statistical arbitrage on AMMs and block building on Ethereum – Part 1
by Christoph Rosenmayr, Mateusz Dominiak – September 10, 2024
In this post, we aim to better understand statistical arbitrage (stat arb) on Ethereum mainnet and how it relates to and impacts block building via mev-boost. We also explore the scope of the stat arb market and which parties win and dominate stat arb opportunities.
This is the first part in a series on block building. The next part will focus on the dynamics of exclusive orderflow in mev-boost and how it is reshaping the block-building market.
Thanks to the team at Titanbuilder, Alcibiades and Grug at Warlock, Anatoly at Liquorice, Nathan at Euphoria, Wee Howe Ang at Tokkalabs for feedback and review.
Key Takeaways
- $175B or roughly 28% of the total post-merge Uniswap v2 and v3 volume result from stat arb transactions. The top9 stat arb contracts contribute 77.82% of total stat arb volume, with 60.83% of the total stat arb volume coming from the three vertically integrated searcher builders (beaverbuild, rsync, manta-builder), which trade x2.2 larger mean swap sizes. In ETH-stablecoin pools, even upwards of 45% of the total pool volume comes from stat arb.
- While 28% of the volume comes from stat arb, only 2.44% comes from atomic arbitrage. This is an indication that, e.g., cross-chain atomic MEV might also not be competitive with stat arb of every opportunity across chains to the CEX price.
- Manta-builder, operated by Jane Street before shutting down, gives an interesting insight into how traditional HFTs can outcompete their more crypto-native counterparts (scp, wintermute). We show block win rate depending on ETH price spread, where manta goes from low single digit market share to even overtaking beaverbuild for the blocks with large stat arb opportunities.
- We estimate the profit margins of individual stat arb opportunities by taking advantage of the fact that vertically integrated builders bid their trueEV for the opportunity in the bundle merge and take profit on their builder.
- We see stat arb profit margins increasing over time, opposite to the expectation of efficiency increasing over time and eroding margins.
- By quantile binning, we see a strong correlation between larger opportunities leading to larger profit margins, highlighting the economies of scale from inventory requirements reducing stat arb competitiveness.
- An average of 18.72% of the entire mev-boost block value comes from statArb bribes, which are just 0.48% of all transactions by count.
Since the merge in September 2022, around 90% of blocks have been built via mev-boost, an implementation of proposer-builder separation (PBS). This allows validators to outsource the job of block construction to a set of sophisticated actors known as block builders, who compete in the mev-boost auction to create the most valuable block. In this post, we aim to better understand statistical arbitrage (stat arb) on Ethereum mainnet and how it relates to and impacts block building via mev-boost. We also explore the scope of the stat arb market and which parties win and dominate stat arb opportunities.
Defining AMM stat arb and LVR
Given the unique existence of truly atomic arbitrage opportunities in crypto, where a risk-free profit can be unlocked in a single block (e.g., atomic DEX-DEX arbitrage), we can broadly define statistical arbitrage as non-atomic, where signals from outside the blockchain (mainly CEX price) are used to achieve a profit in expectation (not risk-free since inventory is held) when the DEX and CEX prices diverge.
This might slightly differ from the TradFi definition of stat arb where a much higher quantity of signals has to be combined for predictive alphas. Stat arb, CEX DEX arb, CeFi DeFi arb, latency arb, etc. all refer to this trading activity.
Since AMMs are the dominant way of trading on Ethereum, stat arb has mainly been explored in the context of AMMs where passive LPs take the other side of all trades including stat arb trades leading to losses in expectation from these trades as arbitrageurs will only trade when they can capture a profit.
This expected loss when trading against informed arbitrageurs has been coined Loss-Versus-Rebalancing (LVR). It’s an arguable, confusingly named metric that could just be called “Arbitrage Losses”.
It aims to quantify the expected losses to arbitrage and distinguishes it from other factors impacting passive LP performance, like delta exposure leading to IL (impermanent loss) and fees earned from non-toxic orderflow.
However, LVR is not necessarily an issue inherent to AMMs, but rather arising out of the properties of the underlying blockchain. On most chains, a single monopolistic proposer can decide all transaction ordering in their block and will often sell priority to the highest bidder. This means even on an onchain order book, a MM (Market Maker) would have to bid equal or larger to the profit the arbitrageur can make to remove their liquidity before the arbitrageur can trade to win the right to move first. This is not sustainable, as this single MM will almost never control 100% of the liquidity the arbitrageur wants to trade against, therefore always being at a disadvantage when bidding for priority vs the arbitrageur.
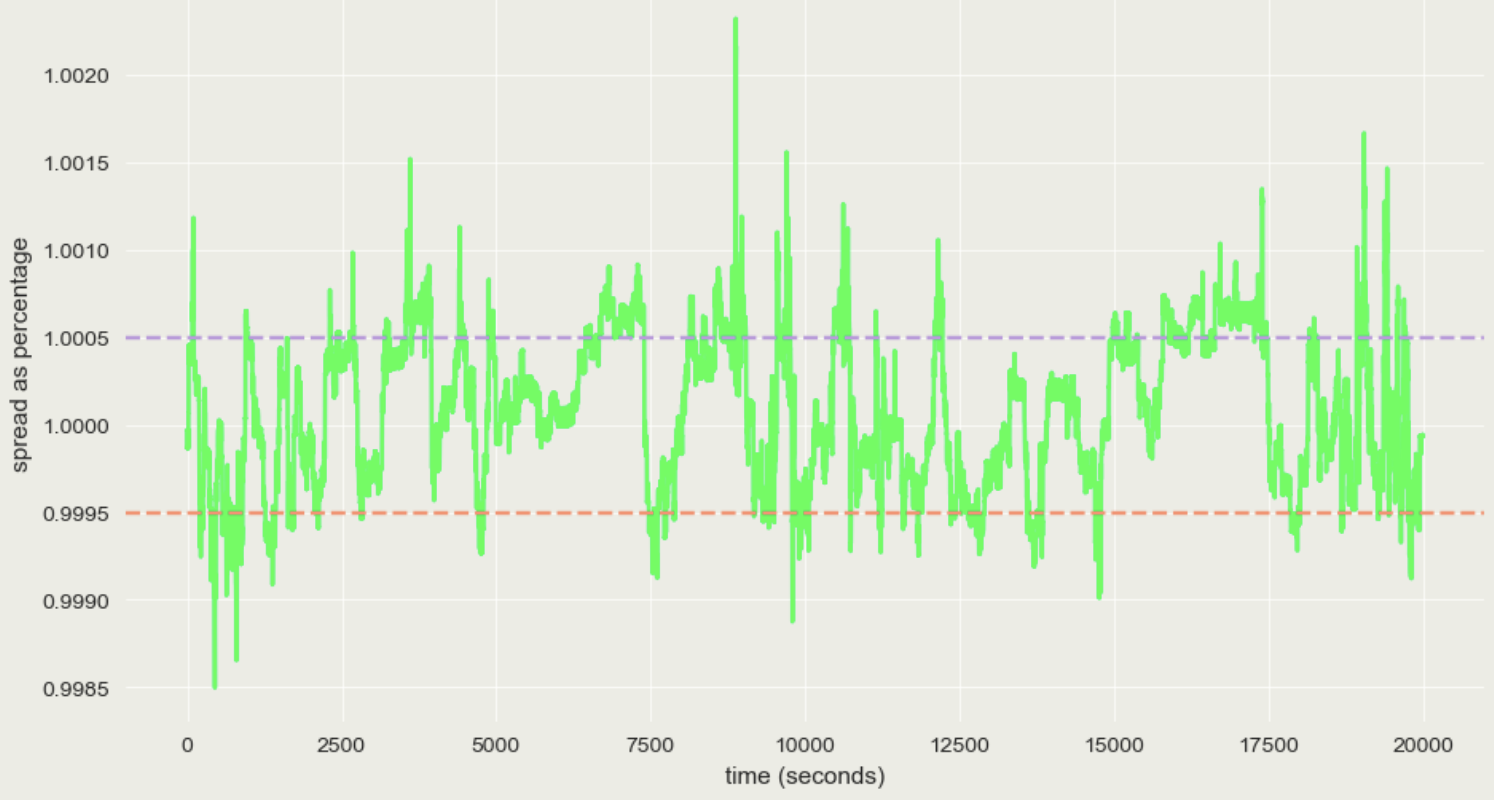
Fig.1: Price spread Uniswap ETHUSDC 5bps vs. Binance ETHUSDC
Factors impacting arbitrage losses
The main properties influencing arbitrage losses for LPs are: blocktimes, gas fees, pool fees, pool liquidity and underlying asset volatility.
To simply understand each of these in more detail, we can look at an empirical example:
Figure 1 shows the price spread (difference) between the Uniswap v3: ETHUSDC 5bps pool price and Binance ETHUSDC spot price over a period of 20000 seconds (5.5h) expressed as percentage. Basically the difference between the AMM and CEX price. The dotted red and pink lines mark a “no arbitrage zone” given by the 5bps AMM pool fee.
We can observe a fairly efficiently arbitraged market where arbitrageurs are willing to bring prices back in line at around 7-10bps mispricing from fair value. This is impressive given more variable costs like CEX fees or gas fees are not even included in the “no arbitrage trade zone”.
Fig.2: Price spread Blocks pre and post block 17162775
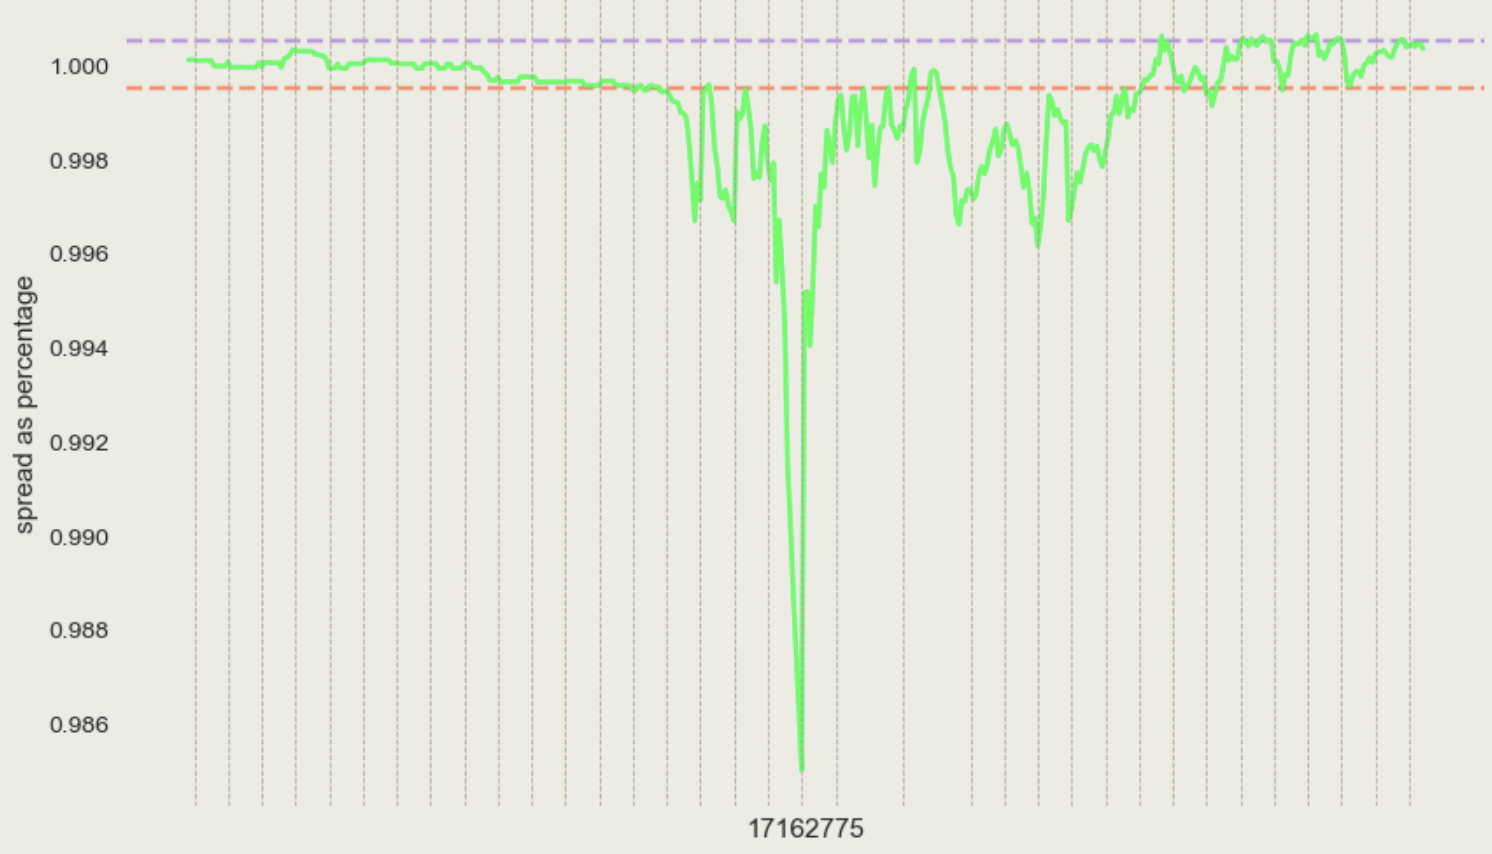
Figure 2 shows the same price spread, however, during a much more volatile period, a few blocks before and after block 17162775. Given that blockchains operate in discrete time, we mark the times when new blocks are produced with vertical lines (missing lines are missed slots). The spread changes between blocks due to price changes on the CEX.
This shows how large arbitrage opportunities arise from long and discrete blocktimes. In the above case, ETHUSDC on Binance fell -1.2% in the 12s between blocks 17162774 and 17162775 (when time on Ethereum is essentially halted), preventing any arbitrageur from taking the opportunity even though they would likely be willing to do so much earlier, at a 7-10bps mispricing. Therefore, only long blocktimes allowed the spread to reach as low as 0.986 in the first place.
In almost all cases, stat arb opportunities arise from the CEX price diverging from the DEX price during the blocks. The only exception would be a back-runnable opportunity from large swaps in the block left open. Most builders even trade these back-runnable opportunities at the end of the block themselves (or auction them to searchers), so this doesn’t really happen.
The next produced block after the down spike in spread was 17162775, which beaverbuild paid 28.64ETH for in the mev-boost auction. Beaverbuild placed its vertically integrated bot at the top of the block to perform 53 unique stat arb transactions to bring prices on most major AMM pools back in line with the CEX prices. Beaverbuilds stat arb contract traded above $14M volume in this single block for an estimated profit of 22.4ETH (roughly $41k at the time).
With this example, it now becomes easier to understand how certain properties affect the gains of arbitrageurs and losses of liquidity providers.
BLOCKTIMES
To summarize, shorter blocktimes prevent large arbitrage opportunities from arising, and arbitrageurs in competition with each other will act myopically and trade off the smallest profit opportunity (considering costs, thereby reducing the adverse selection liquidity providers are subjected to.
Losses to arbitrage, in theory, decrease roughly sqrt(Δt) where t is blocktime, meaning halving the blocktime will reduce losses to arbitrage roughly by ¼ (under a bunch of assumptions like perfect competition and GBM prices). Longer blocktimes being more profitable also means multi-block MEV where the first block is not arbitraged with a larger arbitrage on the 2nd block would be more profitable. However, due to competition, this is not profitable in the current setup.
Losses from arbitrage should logically never go to 0 even with continuous blocktimes (and perfect competition) as price changes are never perfectly continuous but jump from the market impact of individual orders creating arbitrage opportunities.
Shorter blocktimes also reduce some economies of scale of stat arb, like high inventory requirements ($14M in the example above), reduce centralization, and likely increase competition.If we think of blocktimes as latency, this closely resembles some of TradFi’s talking points: investments in HFT latency races are considered to be very wasteful but can still have the positive effect of picking off stale limit orders quicker, which in turn reduces arbitrage losses. This means makers can tighten spreads, leading to better execution.
UNDERLYING ASSET VOLATILITY
This is straightforward. Higher volatility will lead to more frequent CEX-DEX price divergence, which means more profitable arbitrage opportunities. Here, arbitrage losses increase sigma ^ 3 with daily volatility (sigma). Therefore, considering volatility when providing liquidity is key not only to managing your delta exposure (IL) but also to estimating losses from arbitrage.
GAS FEES
The “no arbitrage zone” in the above example only considered pool fees. However, gas fees can be thought of as also increasing the “no arbitrage zone” beyond the fee spread, leading to larger mispricings, meaning larger losses for liquidity providers without increasing profits for arbitrageurs, as the network captures this as gas fees.
For example, the average swap size of stat arb being $51k divided by $5 gas fees for a swap contributes roughly 1bps to the increase in the “no arbitrage zone.” This is a meaningful increase on average, as it is a constant cost (spread) taken by the network.
POOL LIQUIDITY
Since we are currently only focused on the impact of arbitrage, reducing pool liquidity will also increase losses to arbitrage per unit of active liquidity. This works because lower liquidity again artificially increases the “no arbitrage zone” as arbitrageurs have to roll fixed costs like gas fees over smaller trade sizes (given the lower liquidity), therefore having to wait until a larger mispricing, which leads to larger losses for LPs. However, the impact is likely larger than that of the other three factors mentioned before.
POOL FEES
Similar to pool liquidity, when only arbitrage is considered, increasing pool fees will reduce losses to arbitrage as the price will remain within the “no arbitrage trade zone”.
If pool fees could be set optimally and dynamically per block, losses to arbitrage could be reduced a lot. E.g. In the above example of block 17162775, pool fees should have been almost 120bps, in which case prices are brought back in line with arbitrageurs paying most to LPs via pool fees (and not to the proposer as bid for block inclusion). However, it is obviously hard for the AMM, which is currently using a very simplified approach to pricing assets (fixed fee), to set pool fees optimally without introducing new dependencies like offchain oracles.
Besides, the last two also miss a key part of the equation, the uninformed swapper, which doesn’t have any predictable alphas but pays the pool fee, which therefore is very important for LP profitability. Increasing pool fees (or decreasing pool liquidity) might reduce losses from arbitrage, but if uninformed trading volume is decreased by a larger amount, the missing swap fee revenue will lead LPs worse off in the end. E.g. In block 17162775, around 24 uninformed swaps, each paying 5bps in swap fees to the ETHUSDC pool would have been needed to offset losses from arbitrage in this block.
Getting insights into this elasticity of uninformed orderflow as it relates to factors like pool liquidity or pool fees to set them optimally remains an open research area.
Classification of stat arb
We classify stat arb on Ethereum mainnet since the merge and focus only on Uniswap v2 and v3 by using the following criteria. Any transaction has to satisfy all conditions:
The transaction…
- …includes just exactly a single swap log from either uniswap v2 or v3 (to only include single hop swaps).
- …is within the top 20% of blockspace (position in block).
- …paid an extra non-zero tip for block inclusion, either via priority fees or coinbase.transfer.
- …was sent to the builder privately (via builder rpc) and, therefore, didn’t enter the public mempool before being included onchain.
- …didn’t use more than 320k gas in total.
- …has ≤4 logs/events emitted in total. These are used to exclude atomic arbitrage like dex-dex arbs and generally limit long tail/complex transactions.
We also manually excluded some transactions from e.g. router contracts or mev-contracts affiliated with sandwich MEV like jaredfromsubway.
Since we used fairly restrictive criteria and only focused on uniswap v2 and v3, the results can best be thought of as a lower bound and only on Ethereum.
Stat arb is generally much harder to classify than atomic MEV, as visibility into the other side of the trade on the CEX is missing. This also means we are missing very interesting details about how the hedging behavior of the 2nd leg of the trade looks like on the CEX. It seems most likely that inventory is not hedged instantly but rather accumulated as part of a larger book and offset against flow from other trading activities/arbs in the other direction. Otherwise, when hedging every trade, CEX trading costs would likely erode most profits. Some stat arb might, therefore, also not hedge at all and treat the CEX price purely as a signal.
For an example of how these stat arb transactions look like, see any transaction from beaverbuild searcher.
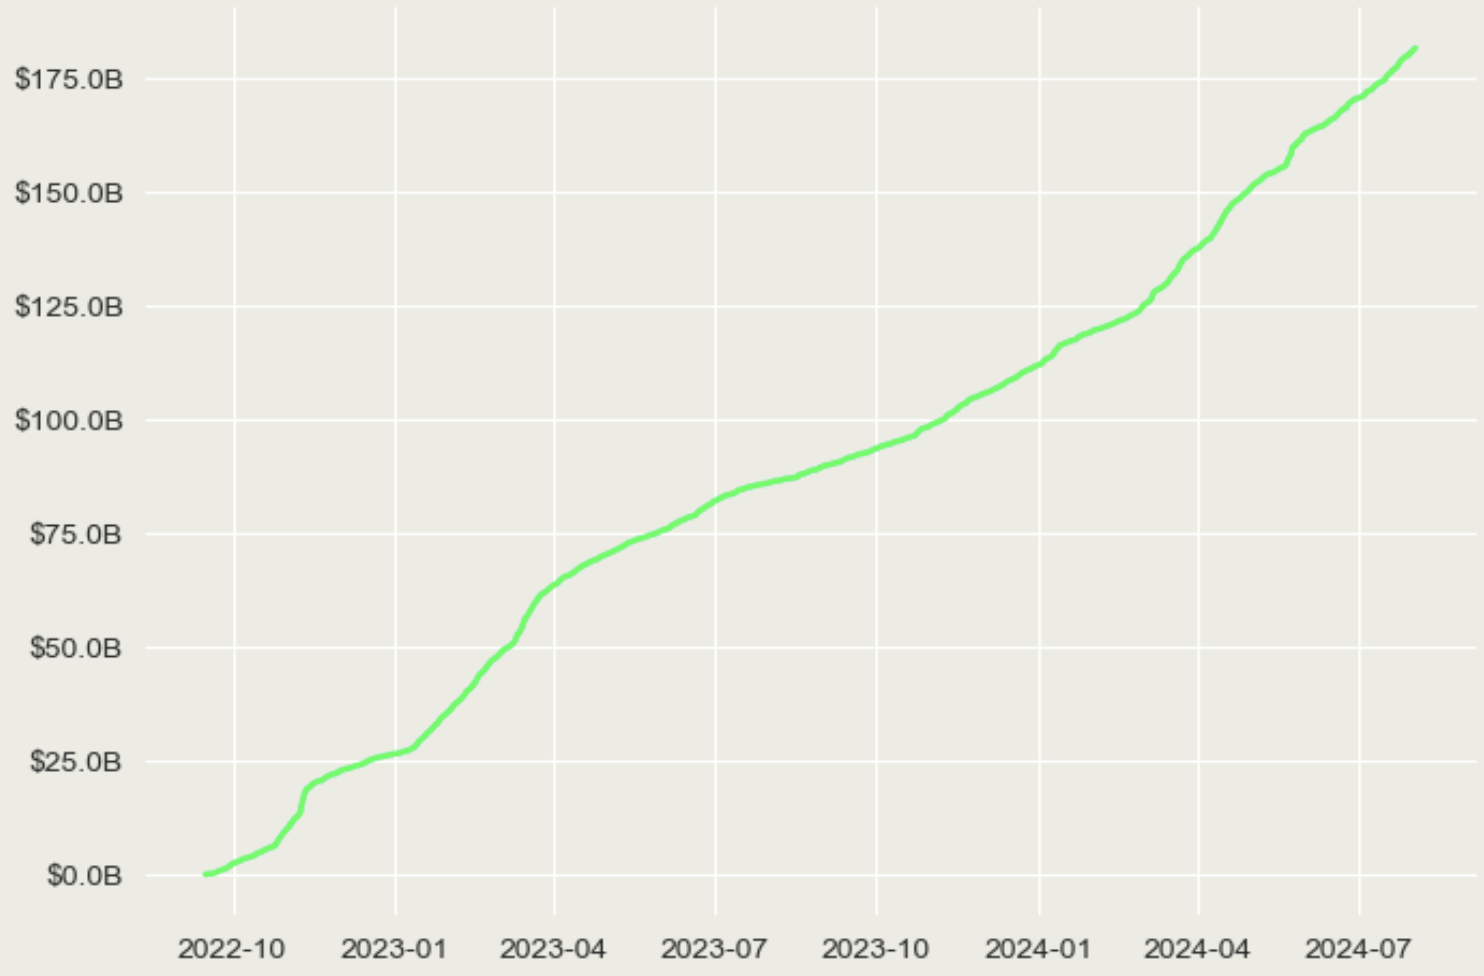
Fig.3: Cumulative stat arb volume from 10/2022-07/2024
INITIAL OBSERVATIONS
We can make a few initial observations.
Since the merge, stat arb transactions have swapped $175B on Uni v2 and v3, which is roughly 28% of the total post-merge Uni v2 and v3 volume on Ethereum.
We can compare this to the $15.3B of post-merge Uni v2 and v3 volume related to atomic arbitrage (roughly 2.44% of total post-merge volume) according to this methodology. With this comparison, the scope and domination of stat over atomic arbitrage, especially since the merge, become clear.
Given the higher trading costs on DEXs compared to CEXs, stat arbs that take inventory risk and pay less to hedge on the CEX are much more efficient than atomic arbs. This makes sense, especially in the case where only one leg of the trade is miss-priced.
We think these clear efficiency advantages of stat arb are important to recognize, especially given that cross-chain MEV likely won’t be extracted atomically but rather statistically and hedged against the CEX.
Since the merge, stat arb transactions have paid a total of 93k ETH or $196M (at the time of payment) in bribes to the block builder (either via priority fees or coinbase.transfer). This transaction is the single largest post-merge transaction proposer bribe. From looking at the swap size (9,999,999.99 USDC), it seems that beaverbuild searcher has a hard-coded max allowed swap size of $10M.
Fig.4: Stat arb bribes as percentage of MEV-boost block value from 10/2022-08/2024
Figure 4 shows the percentage of the total “true” block value (mev-boost block bid + builder profit for the block) coming from the mentioned stat arb-related bribes to the builder. Since the merge, 18.72% of the entire block value comes from stat arb and, therefore, essentially puts a floor on the value of each block on average (with some non-zero level of CEX volatility) and contributes massively to mev-boost blocks being 5 times as valuable as locally built blocks – especially since stat arb related transactions are just around 0.48% of all post-merge Ethereum transactions.
Fig.5: Stat arb searcher builder relationships from 09/2022-08/2024
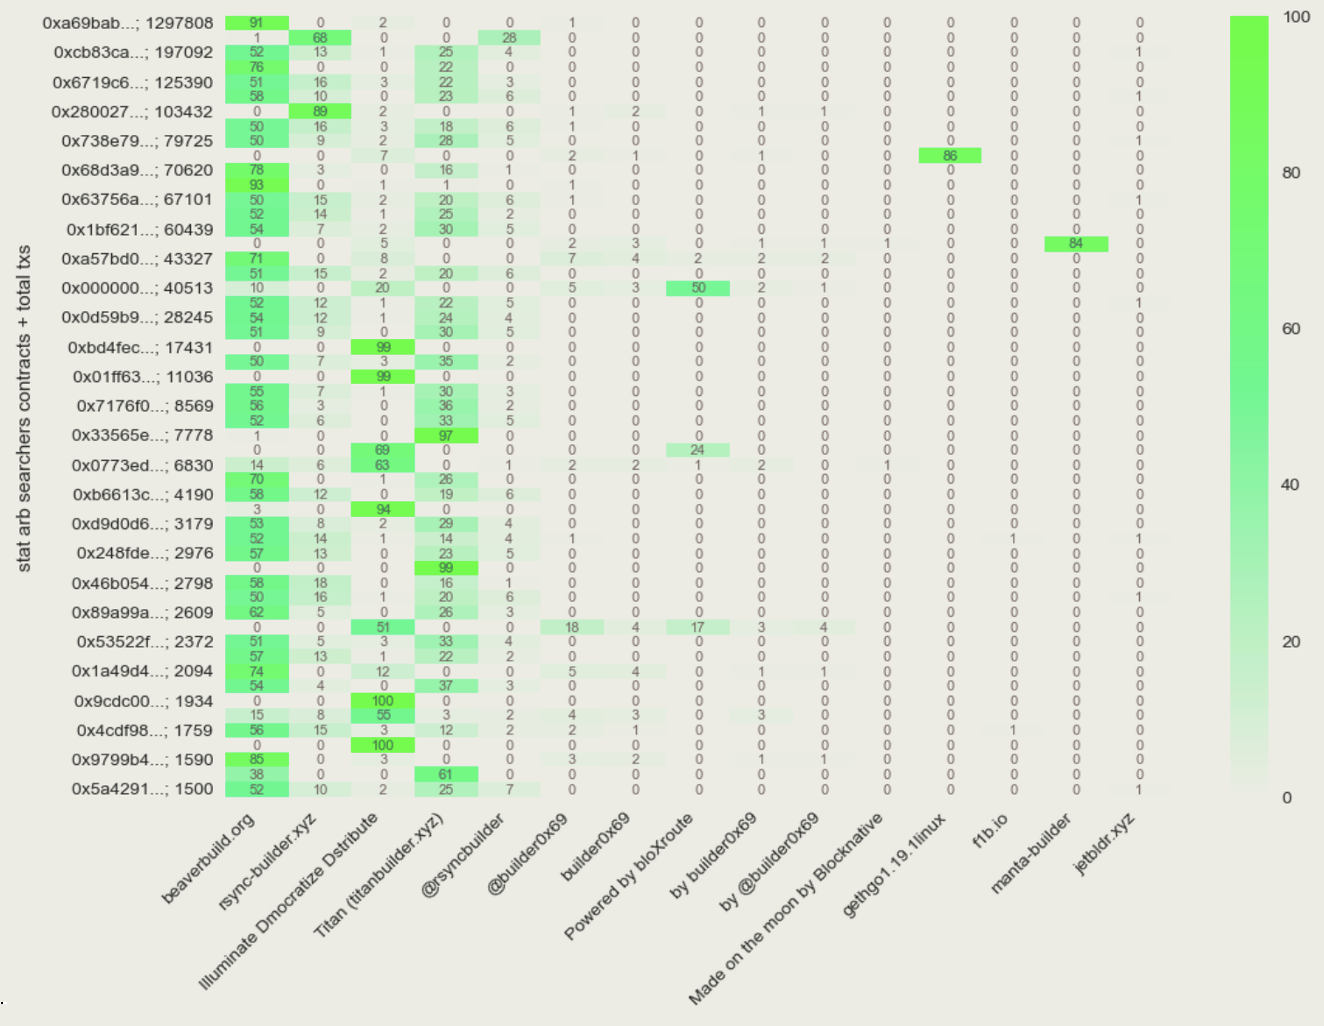
Stat arb searcher builder relationships
While it is no secret which builders are vertically integrated and which are neutral, we used a heatmap to obtain an exact mapping between vertically integrated builders and their stat arb contracts (figure 5).
The y-axis shows the stat arb contracts (not EOAs calling them) with the amount of stat arb transactions classified in our dataset, with the x-axis being block builders classified via the block extra data field. The scale shows the percentage of stat arb transactions per contract included in a certain builder’s blocks. We show only contracts with a percentage value >50 for a builder, given all others are likely neutral by definition.
We can highlight a few additional observations:
- Given beaverbuilds high market share of blocks built, a lot of neutral searchers have to send stat arb flow to beaverbuild, leading to a high number of 50-70% values, but their two vertically integrated searcher contracts with >90% stand out.
- Neither beaverbuild nor rsync share any stat arb flow from their searchers with each other, but also very rarely with neutral builders.
- Especially during the early days of mev-boost, many stat arb searchers would send exclusively to flashbot builder (“Illuminate Dmocratize Dstribute”), which makes sense given the adverse effects of sending orderflow to a builder competing with you for the same opportunity.
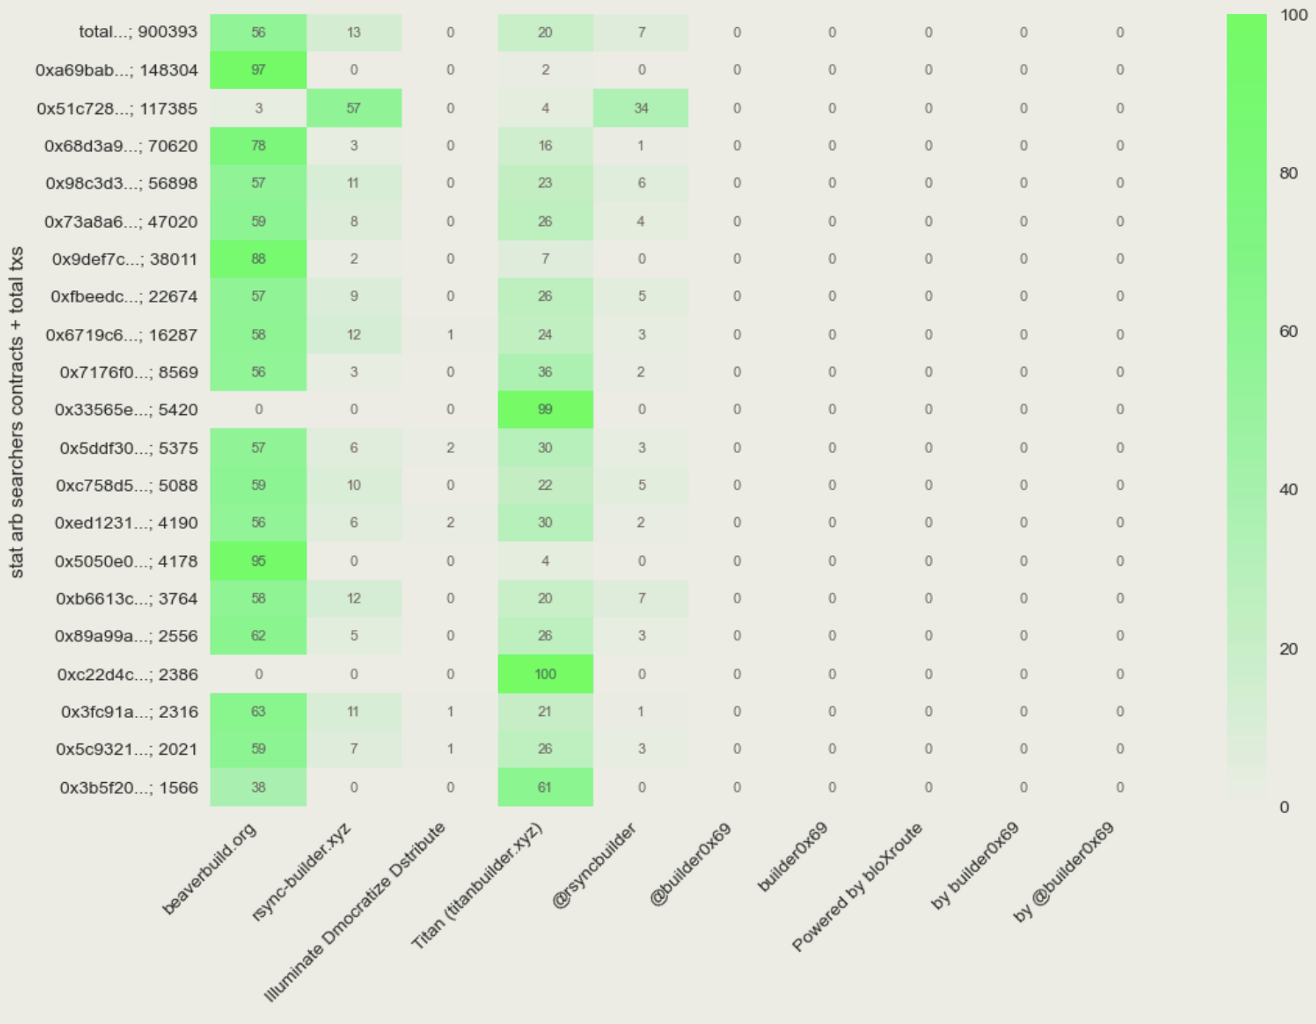
- By looking at the same graph but only showing stat arb activity of a recent two-month period, we see that Titanbuilder, having taken over flashbot’s place as the dominant neutral builder also receives exclusive stat arb flow from 2 searchers (Figure 6).
Fig.6: Stat arb searcher builder relationships from 06/2022-08/2024
MANTA-BUILDER
Manta-builder and gethgo1.19 have been revealed to be operated by the same entity, which was speculated to have been a sophisticated US HFT (Jane Street). They, however ceased operations in May 2023, possibly over regulatory concerns.
As a fun fact to highlight manta-builder dominance during its operating period, in Figure 7, we plot the block win rate for the three stat arb builders depending on the same Uniswap/Binance ETHUSDC spread shown above.
We used a sample period of 300k blocks when Manta-builder was active.
Fig.7: Percentage of blocks built per ETHUSDC spread
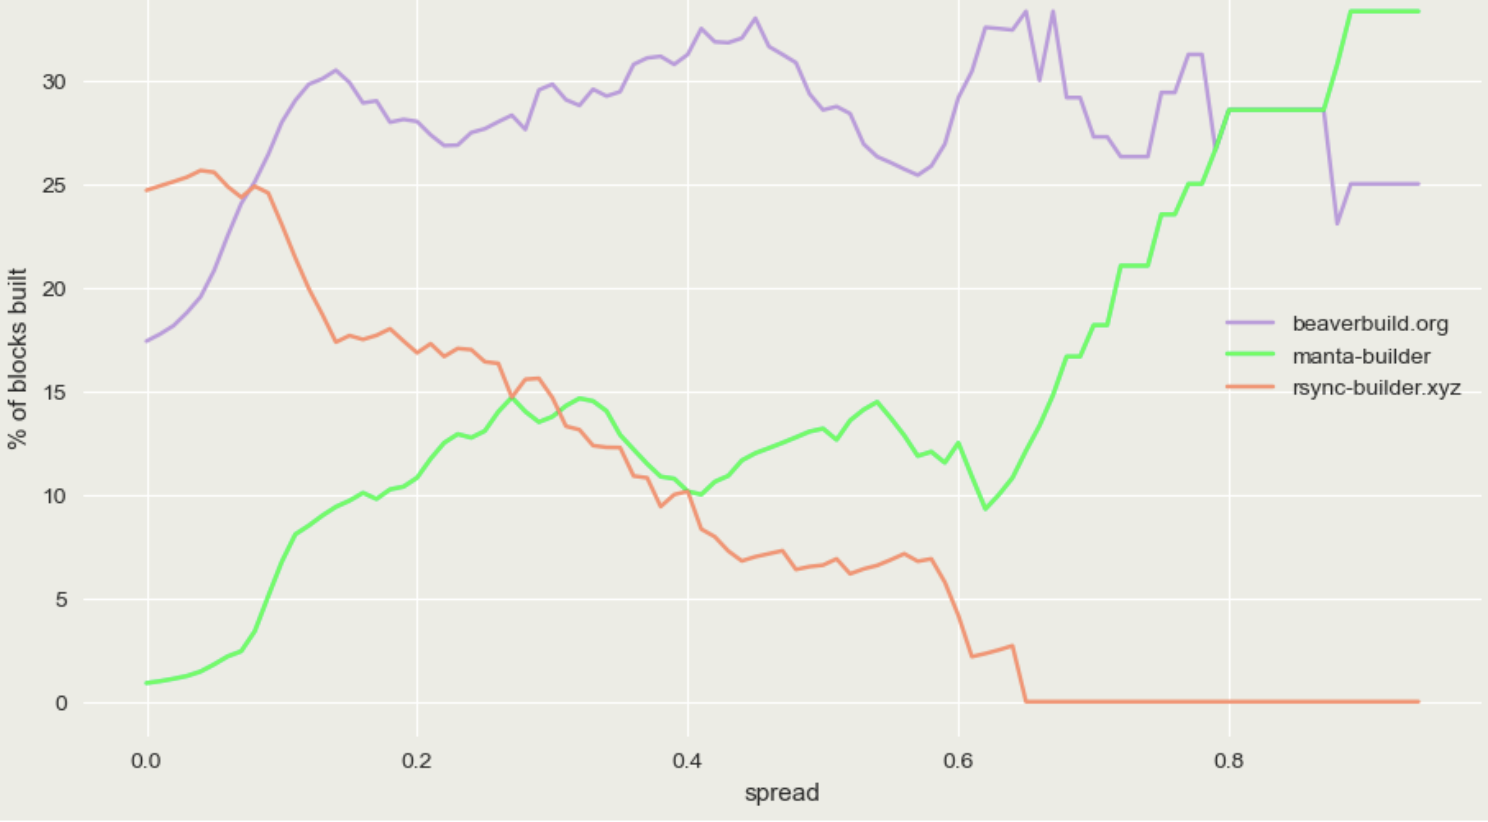
Therefore, the y-axis shows the block win rate per builder, depending on the value of the spread at the time of block construction.
We can observe how all stat arb builders instantly gain or at least keep (rsync) market share once the spread mispricing goes to 10bps (the mispricing where stat arb starts to happen, as shown above). This highlights how stat arb builders gain an edge over neutral builders on blocks with arbitrage opportunities.
After that, we can observe how manta-builder goes from a low single-digit market share to even overtaking beaverbuild for the large spread blocks of above 70 bps – by taking market share mainly from rsync but also beaverbuild.
It is a very interesting showcase of how existing incumbent crypto-native HFTs (high-frequency traders) like SCP (beaverbuild) and Wintermute (rsync) can be outcompeted by more traditional large US HFTs. Which can be insanely competitive at winning blocks with large stat arb opportunities even while paying little attention to most other blocks/bundle merging optimization or acquiring neutral searcher orderflow.
It is likely that a lot of Mantas’s edge resulted from their traditional alpha models carrying over to create a more efficient prediction of the true price in the future (compared to just binance price), which could allow them to, e.g., correctly hedge the intrablock price spike and, therefore, outbid the competition at the end of the block.

Advantages of vertical integration for stat arb
To understand why vertical searcher<>builder integration is mainly happening in the context of stat arb in the first place and not atomicArb, we summarize the main efficiency gains of vertical integration:
- Non-vertically integrated stat arb searchers have to submit their bundles and associated inclusion bids to the block builder without much additional information “blind”, while vertically integrated searchers can observe these bids via their builder and outbid just slightly. Therefore, neutral searchers compete in blind auctions, while vertically integrated searchers builders compete in a second-price auction.
- There is a latency difference between when searchers submit bundles and when the block auction in mev-boost ends. Vertically integrated searchers can gain an edge by bidding the true value for any arbitrage opportunity when submitting the bundle to the builder and deciding on bid shading slightly later in the builder mev-boost auction while having the most possible information.
These advantages lead to more efficient bid shading and lower latency, which are much more pronounced when competing for stat arb. The “true value” of the opportunity fluctuates with price changes on the CEX during the slot and can, therefore, lead to adverse selection/winner’s curse of slower and less informed players. This is unlike atomic MEV, where bid values remain rather constant throughout the slot.
As shown above, this efficiency gain is highlighted by the fact that 90.7% and 94.5% of stat arb transactions from beaverbuild/rsync searchers land onchain in blocks of their respective vertically integrated builders. Vertical integration doesn’t work because “you are paying yourself, therefore keeping the money” regarding inclusion bids as there is always an opportunity cost of not including another stat arb searchers transaction + bid competing for the same opportunity, so the efficiency gain is the difference between the two.
Fig.8: Vertically integrated stat arb from 04/2023-08/2024
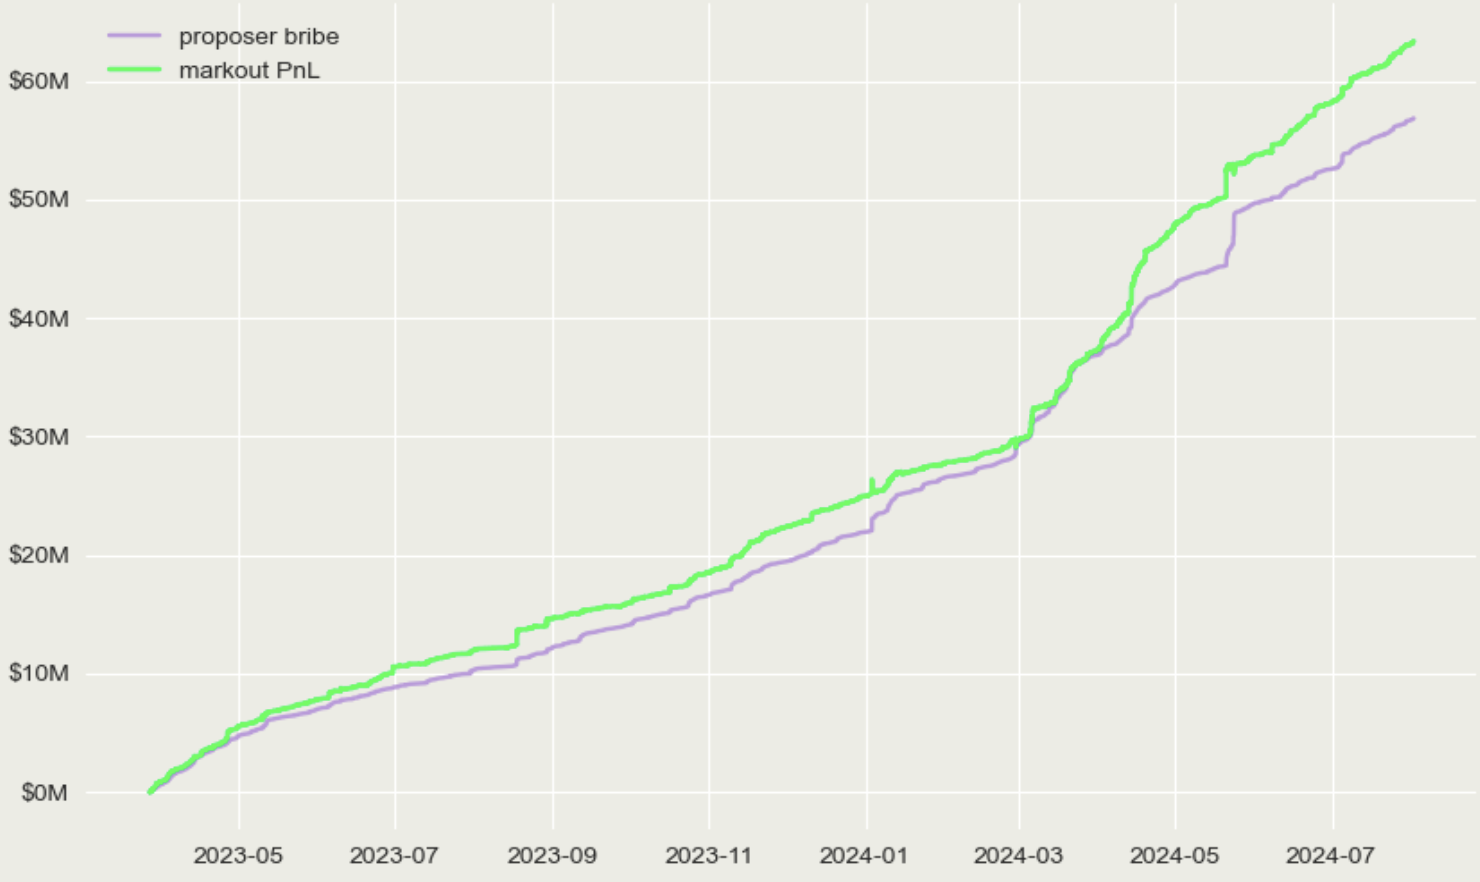
To confirm vertically integrated bidding truthfully when submitting bundles to their own builder and taking profit (shading their bid) only in the mev-boost auction, we can compare bribes to the builder with markout PnL for the vertically integrated searcher builders only – see Figure 8. Markout is a metric to estimate arbitrage profits (basically the trueEV of the opportunity before costs like bribes).
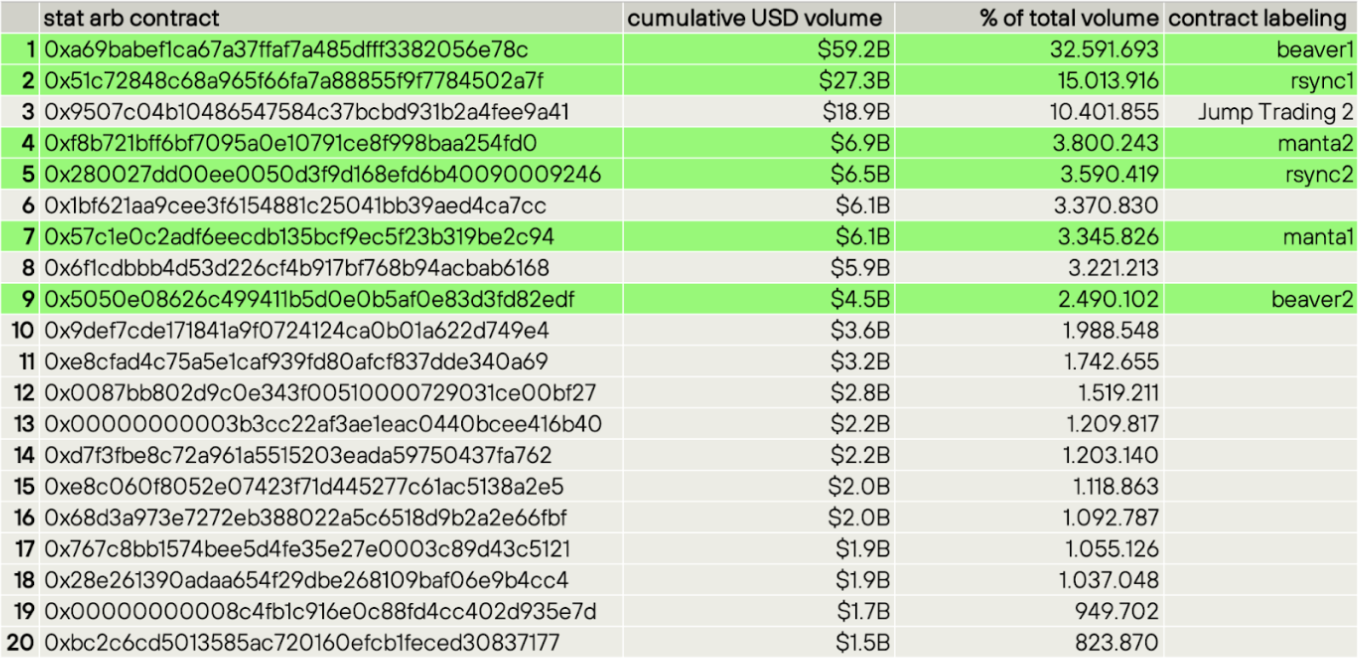
Fig. 9: Top20 stat arb contracts by volume since the merge (09/2022-08/2024)
Competition for stat arb
In Figure 9, we group our stat arb dataset by unique contract addresses (not the EOAs calling them) and show the top20 stat arb contracts by volume since the merge.
We label the above-identified vertically integrated searcher builder contract and the address tagged as Jump Trading 2 on etherscan. This highlights the extreme centralization of stat arb, as the top9 contract contributes 77.82% of total (stat arb) volume, with 6/9 being vertically integrated (highlighted in green) and contributing 60.83% of the volume.
Fig.10: Cumulative USD swap volume of vertically integrated compared to non-vertically integrated from 10/2022-08/2024
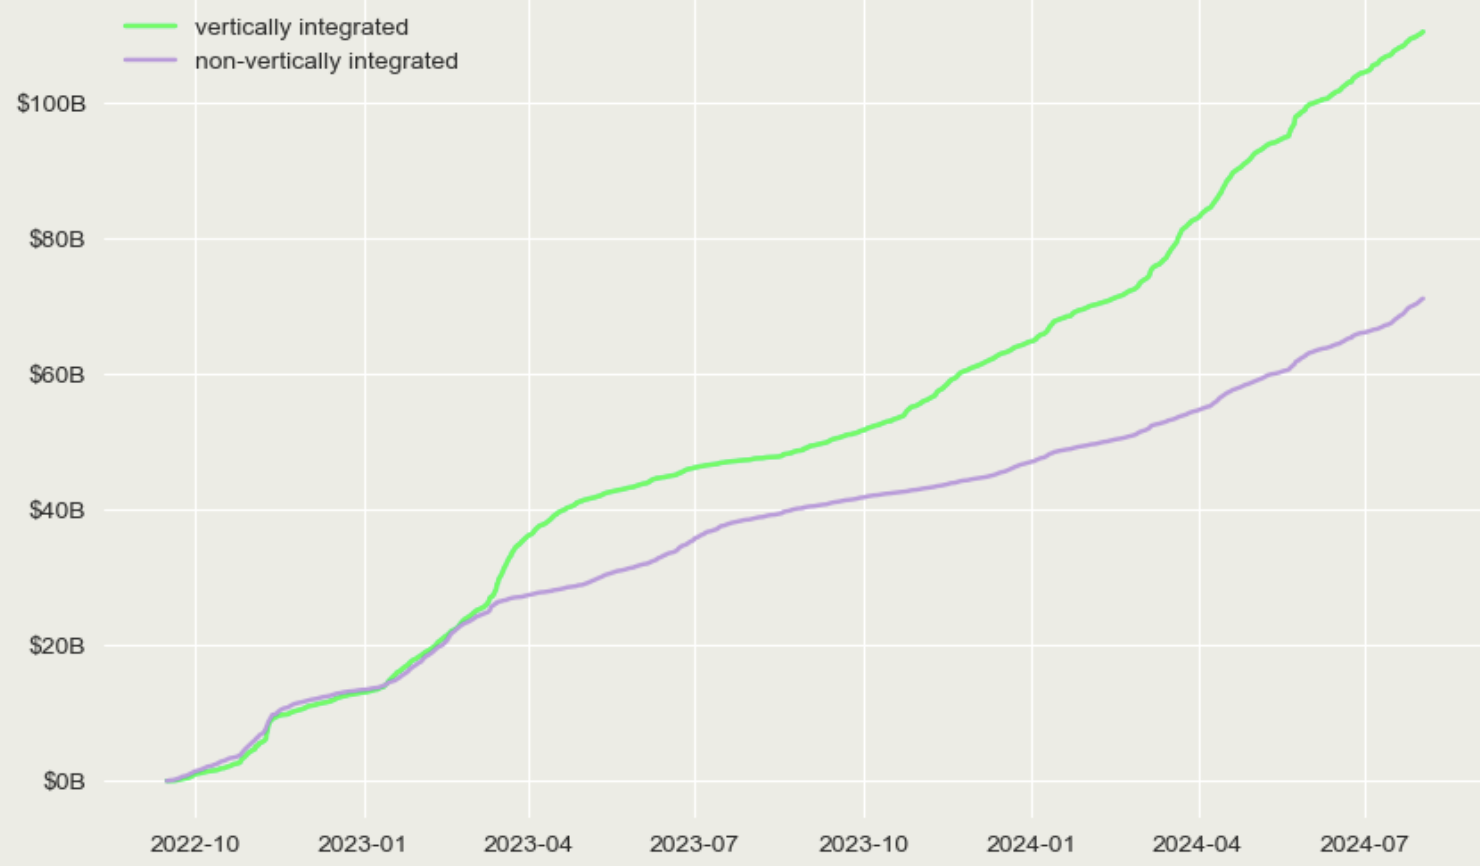
This difference in volume is even more noteworthy as the non-vertically integrated searchers send 1.4x as many swap transactions, meaning vertically integrated searchers had average swap sizes x2.2 larger (means: $75k vs $34k).
Fig.11: Cumulative USD swap volume of non-vertically integrated stat arb from 10/2022-08/2024
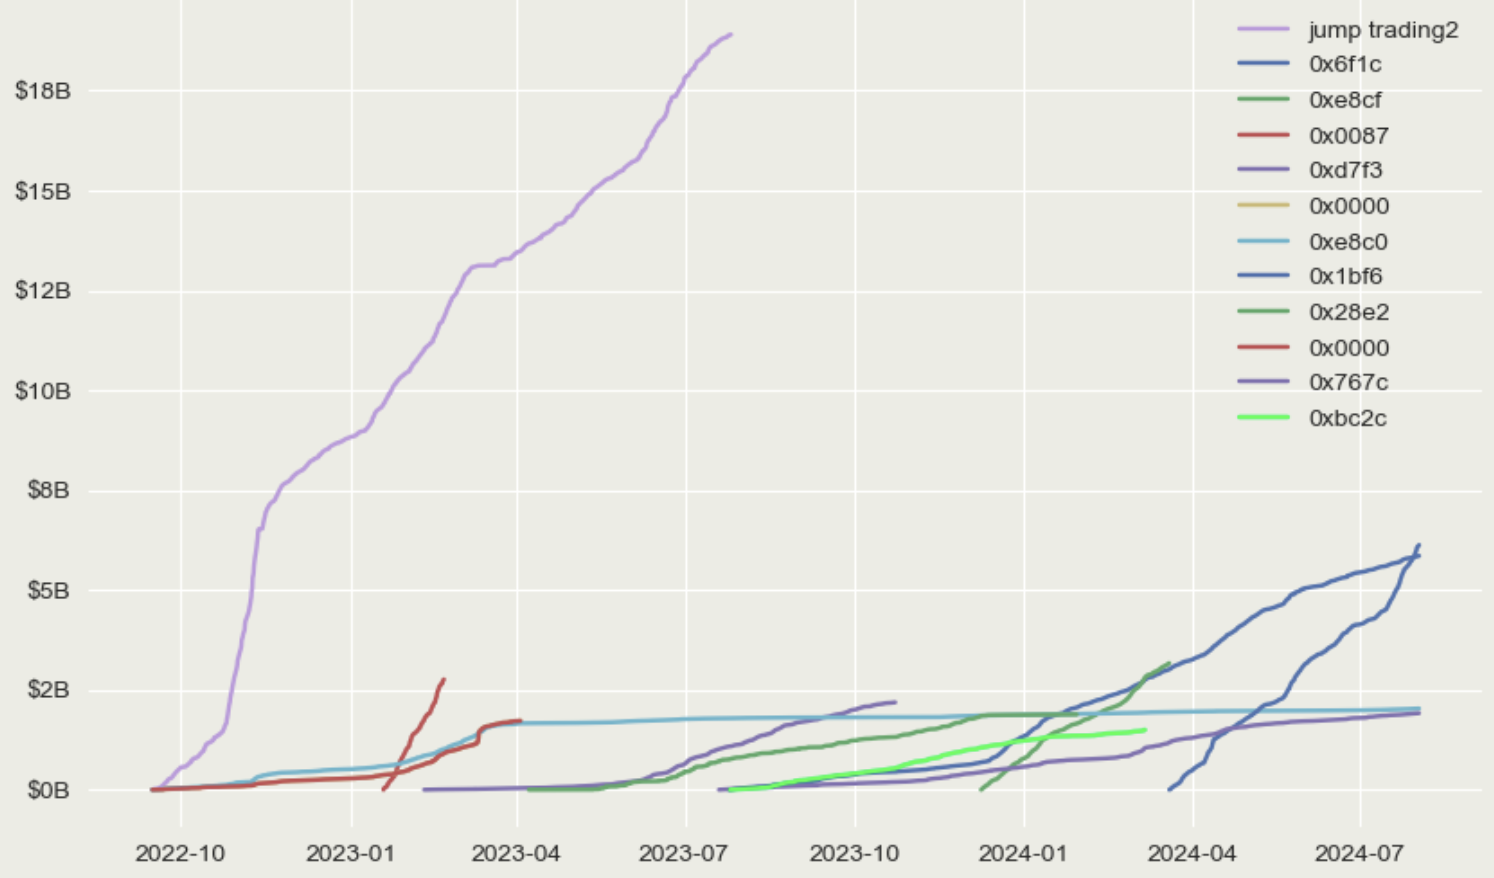
Fig.12: Cumulative USD swap volume of vertically integrated stat arb from 10/2022-08/2024
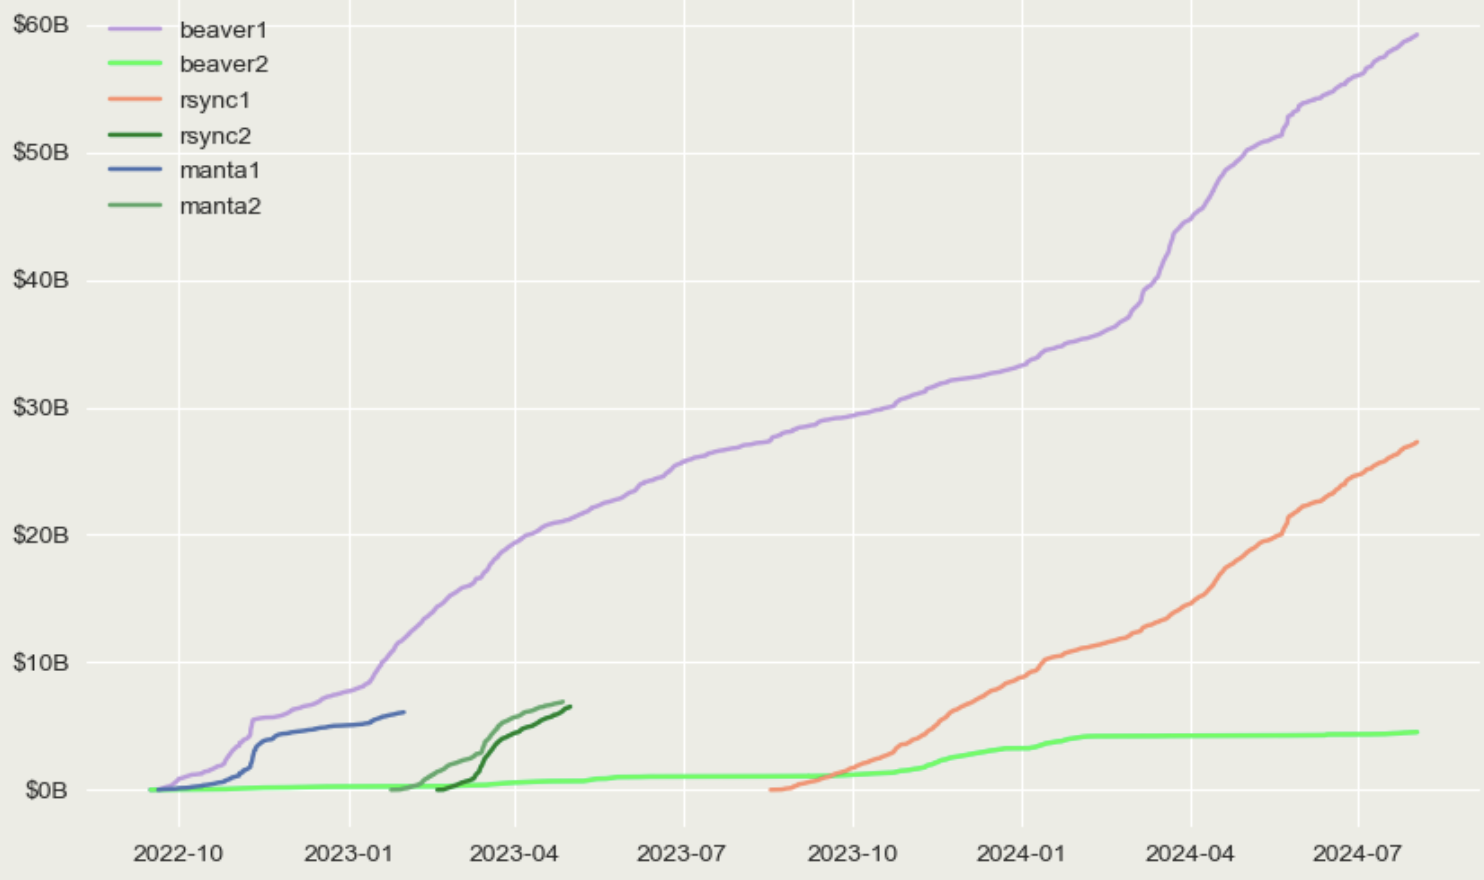
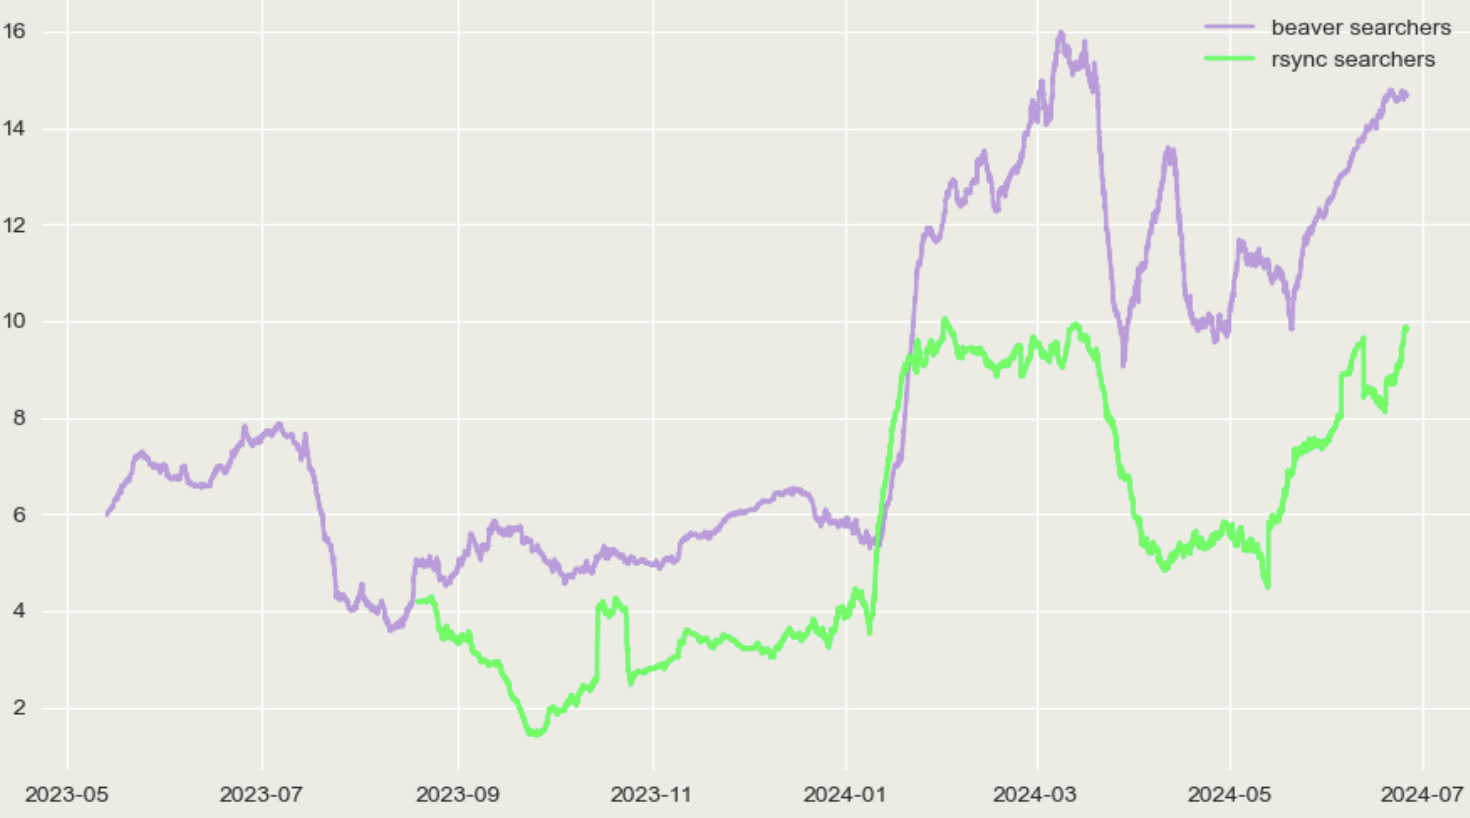
The plots above show beaver1 relentless domination, especially after Jump Trading 2 shut down in August 2023, which seemed to be the only neutral searcher able to keep up. Beaver1 was also able to aggressively increase stat arb volume, starting March 2024. The high turnover in non-vertically integrated searchers vs. the relative persistence of beaverbuild and rsync shows the challenges in competing.
More recently, 0x6f1c was the first neutral stat arb searcher to break $5B since Jump Trading 2, and another neutral searcher 0x1bf6 is seeing even faster volume growth. Observing a slight resurgence in neutral searching is an interesting sight!
Fig.13: Total volume by Uniswap pool type and user
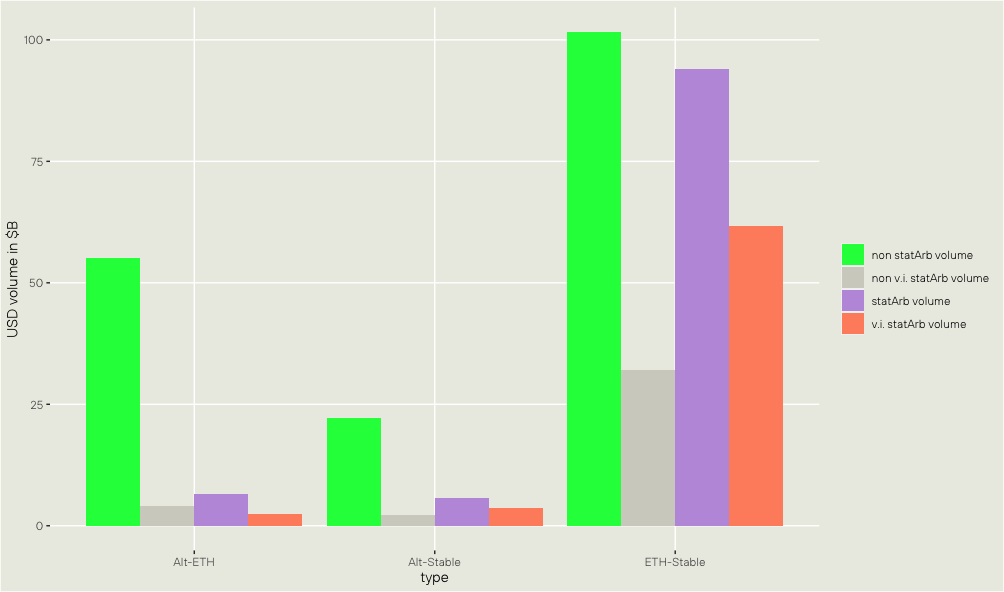
We group volume on Uniswap v2 and v3 into three categories depending on the type of pool being Alt-ETH, Alt-stable or ETH-stable and contrast:
- total stat arb volume
- total volume not related to stat arb
- total vertically integrated stat arb volume
- total non-vertically integrated stat arb volume.
We see that vertically integrated searchers are especially dominant on the ETH-stable pool, where they account for upwards of 45% of the total pool volume (turquoise is not a subset of red).
While Alt-ETH pools see a much lower share of total stat arb volume as a percentage of the pools’ total volume, non-vertically integrated searchers seem to have the upper hand there as they contribute more volume.
Fig.14: Top350 pools stat Arb by type
However, as Fig. 14 shows, this mainly results from the vertically integrated searchers choosing not to compete for the long tail of Alt-ETH pools and not an inherent increase in competitiveness for neutral searchers on Alt-ETH pools.
Fig.15: Top350 ordered stat arb percentage
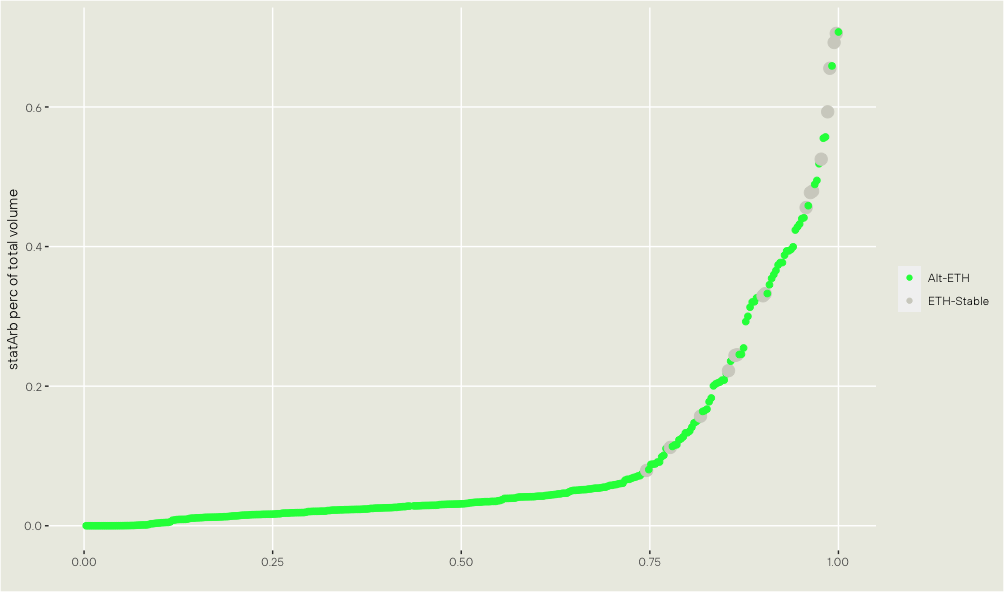
Figure 15 plots the top350 Alt-ETH and ETH-stable pools, ordered by their percentage of stat arb volume of the total pool volume. As expected, we see ETH-stable pools near the top, with up to above 50% of certain pools’ volume coming from stat arb.
We see a non-zero percentage of volume from stat arb for most pools. This could be due to assets only listed on long-tail CEXs or even more creative ways to use offchain pricing signals to trade the asset truly statistically.
We can also observe a noticeable kink in the curve, at the point of the lowest % stat arb volume (highest fee) ETH-stable pool, after which stat arb percentage increases fast. It is likely that this point corresponds to assets having a listing on one of the major CEXs.
Fig.16: Alt-ETH pools vertically integrated stat arb
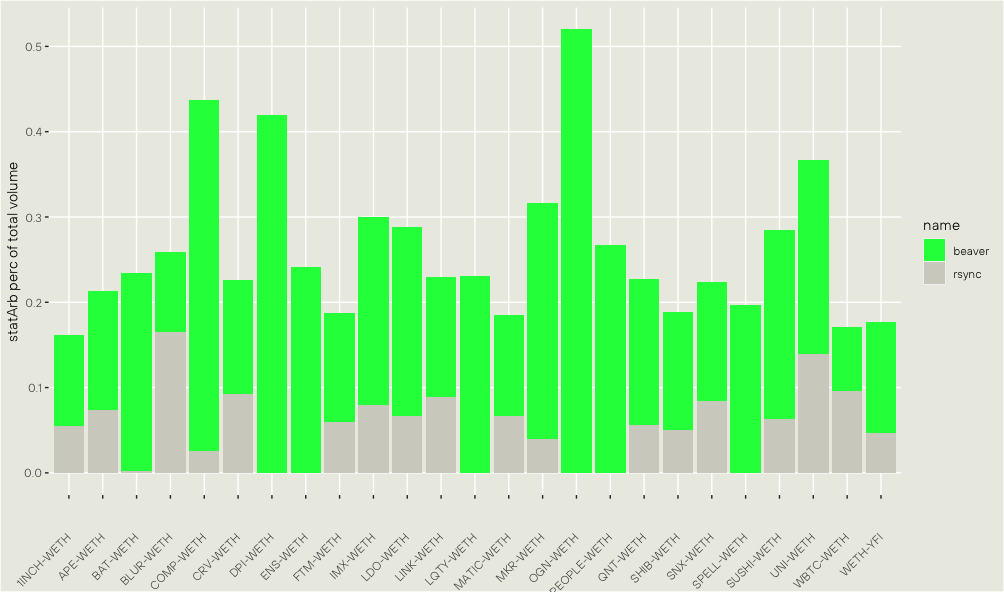
This highlights the Alt-ETH pools with the highest percentage of stat arb volume (of total pool volume). We were initially looking for signs of implicit cooperation between Beaverbuild and Rsync, where they, e.g., don’t compete for arbing the same pools. However, that doesn’t really seem to be happening.
Given we already calculated stat arb percent of total pool volume and markouts per pool, we can estimate the strength of the relationship between these two variables. We normalize total markouts by total swap volume to get something more akin to an average per swap toxicity.
Fig.17: stat arb percentage and markouts correlation
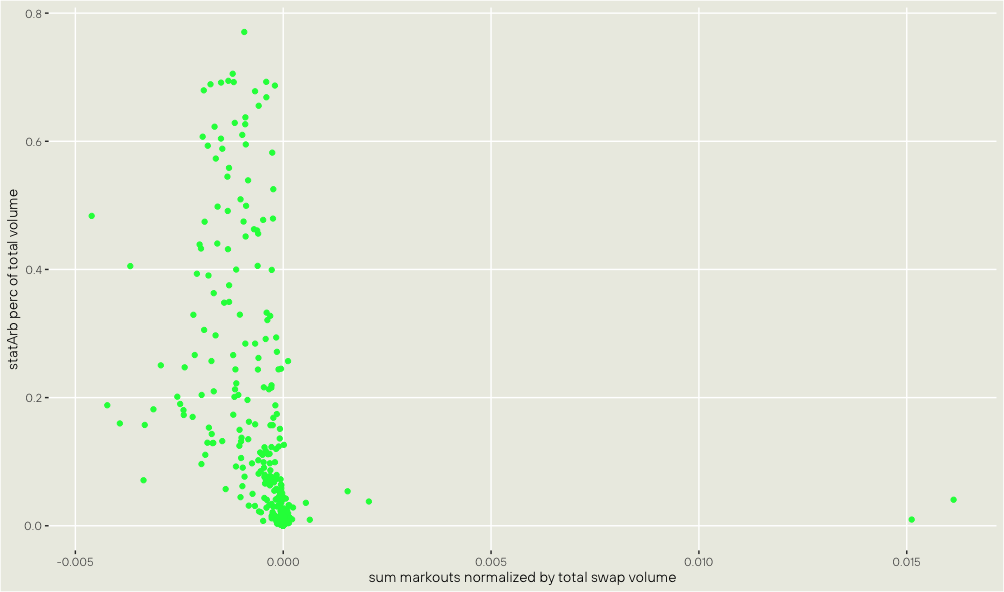
This shows an expected result: pools with a high percentage of stat arb don’t tend to perform well in terms of LP profitability (sum markouts). A rank-based measure shows a very strong relationship (Spearman correlation: 0.788).
Fig.18: normalized average stat arb profit margins from 05/2023-07/2024
Estimating stat arb profit margins
We calculate block builder profits with native ETH balance_diffs of builder addresses before the first and after the last txs in the block (which is the mev-boost payment to the validator). We also excluded txs where the builder sends a tx (from_address), e.g., to fund his integrated searchers or send profits to cold storage.
This allows us to estimate the profit margins of stat arb via block profits for the vertically integrated builders since only they bid their true value in the bundle merge (as shown earlier) and take profit on their builder, unlike neutral stat arb. We do this only for blocks that don’t contain other transactions generally known to generate high profit margins for builders, like Telegram bot orderflow.
To transform block-level builder profits to more of an average per transaction we divide the builder profits for beaverbuild and rsync by the amount of stat arb transactions from their associated vertically integrated searchers.
Of course, in any single block, there might be other exclusive transactions leading to builder profits, but we can assume these to average out (at a low level of 1-2%) and therefore allow us to get an estimate of average stat arb competitiveness over time.
This basically shows how efficient the current mev-boost auction is at recapturing value for proposers, which was previously estimated to be 37-77% (of stat arb profits being bid back to the proposer).
Fig.19: average stat arb profit margins per quantile from 05/2023-07/2024
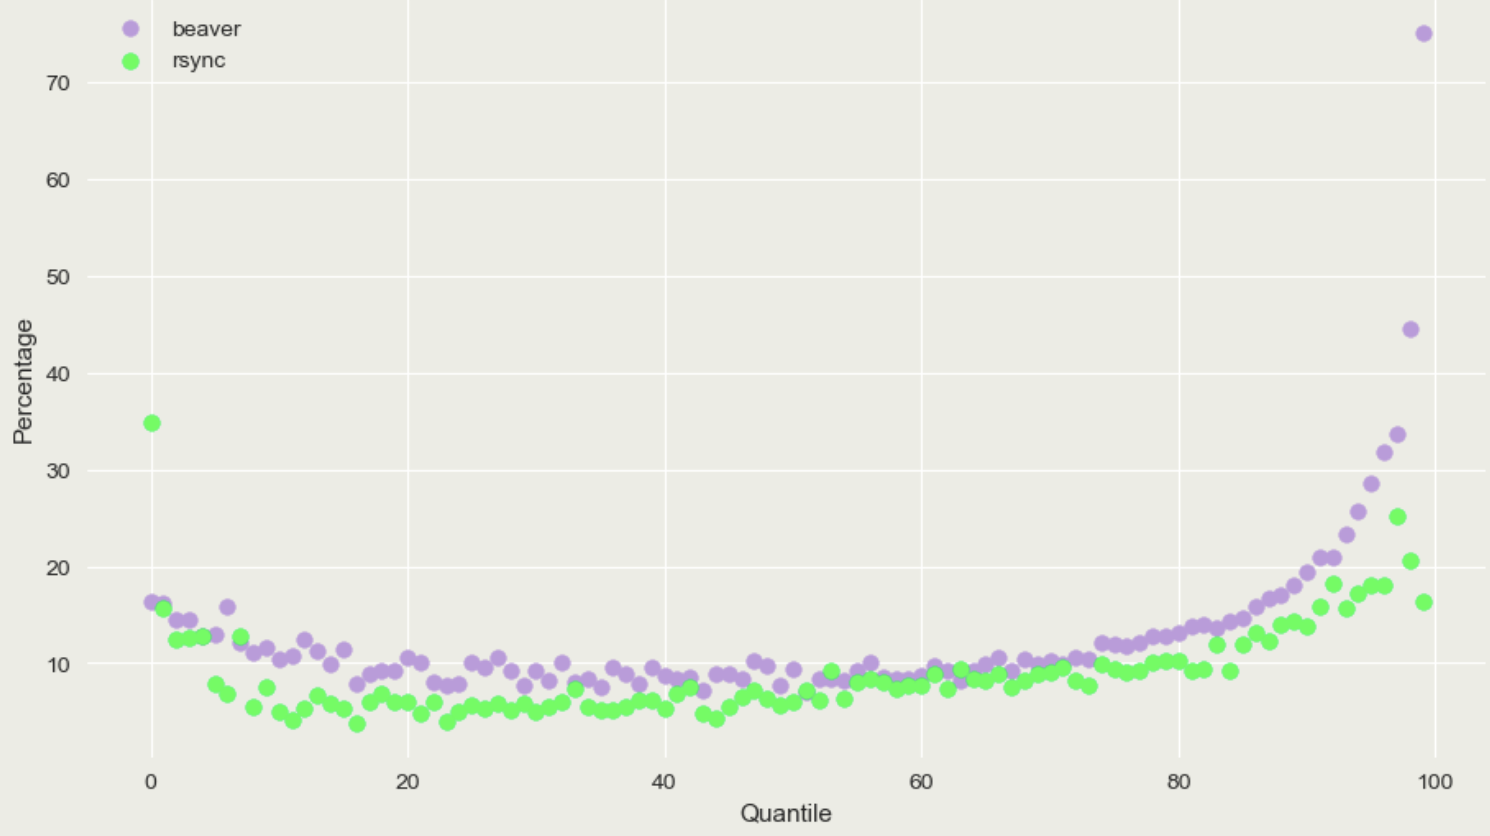
We Quantile Bin (same amount of values in each bin), the above normalized stat arb profit margins depending on their respective percentage of block value from stat arb bribes from their searchers. The result also looks very similar when binning on the mev-boost block value or notional bribes from stat arb.
We see a sharp increase in profit margin capture above the 90th quantile, which makes sense given the large capital requirements to perform stat arb in these highly valuable blocks where a large % of the block value comes from stat arb. Beyond the 90th percentile is also where beaverbuild build gains the most edge on rsync; the exact reasons for this are unclear.
Conclusion
Relying on perfect competition of stat arb auctions clearly seems wishful thinking, especially if the system intrinsically creates economies of scale that even become more pronounced at times when they are least desired: the highest-value arbitrage blocks.
These topics around auction competitiveness also become especially important when considering potential designs aimed at minimizing the arbitrage losses of LPs on AMMs e.g. via ex-post/ante auctions.
To some extent, we would initially always expect the mev-boost auction to be the most competitive. However, the opposite might be true as advantages for vertical integration (economies of scale) are unique to mev-boost and generally, more fragmented AMM-specific auctions (e.g., multiple protocols with unique ex-post auctions) might decrease profit margins captured by arbitrageurs compared to mev-boost given the significant relationship between high-value opportunities and increased profit margins shown above.
Besides the above-mentioned (ex post/ante) auctions and dynamic AMM fees to reduce arbitrage losses, some interesting but less explored areas of AMM research include:
- increasing returns for LP providers by repurposing/increasing composability of LP positions
- credible way of signaling non-toxicity (e.g., giving up time priority)
- directional execution via the making of liquidity
The latter two resemble how order books already tackle this similar problem. By placing a limit order in the book, you are giving up time priority (“willing to wait”) and therefore credibly signaling non-toxicity, as you don’t possess any short-term time-sensitive alpha.
By using limit orders, you get improved directional execution (with non-execution risk) while also providing liquidity for takers. This means that in an order book, liquidity makers can net lose money via adverse selection, but since a subset of them is mainly interested in making to get directional execution, this is still a cost worth paying (lower than taker fees).
If you are interested in these topics, feel free to reach out on telegram.